图片来源:Intel VTune Profiler Cookbook:Top-down Microarchitecture Analysis Method。
1.CPU Architecture
- CPU流水线架构
- 前端:取指令、解码、把uOP发送到后端
- 后端:allocate uOP、执行uOP,执行完成(retirement)
流水线架构图
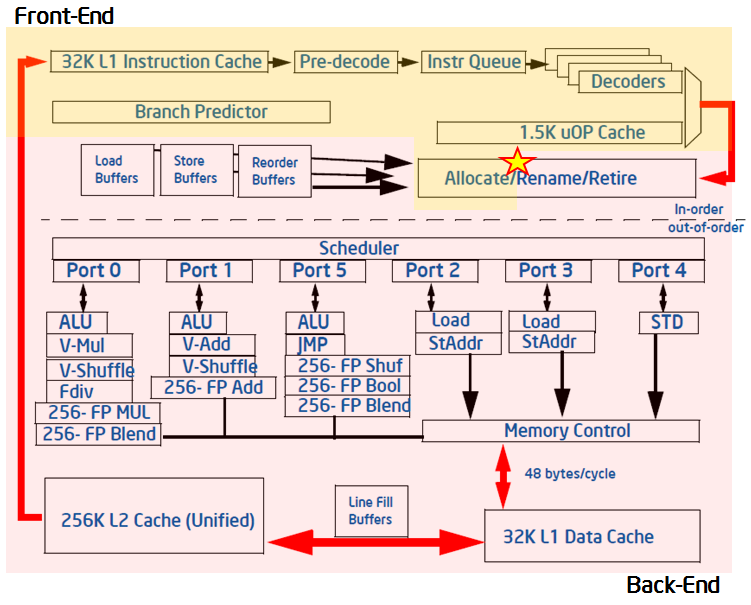
- ROB:ReOrder Buffer,乱序缓冲区,指令是乱序执行的,但要按照原顺序提交运行结果(in-order retirement),用来暂存乱序的指令结果,一般实现是一个环形队列
- 后端很多个执行端口有不同的执行单元
- L1 I/D cache,L2 cache一般每核私有,LLC一般共享
- pipeline slot:一个周期内处理一个uop所需的硬件资源/位置,intel CPU FE/BE:4 slots/cycle。
- slot的状态在allocate处获取
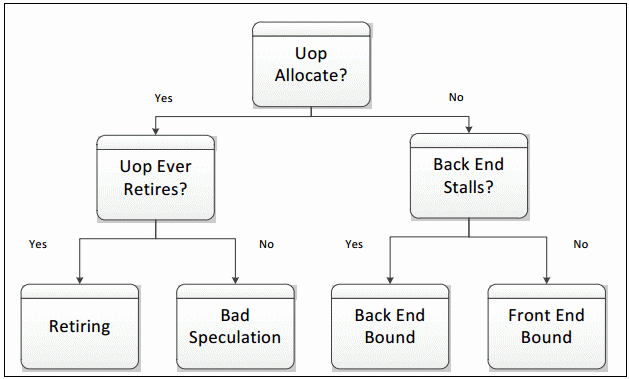
- 一个slot在一个周期内是空的,被归于stall,使用TMA可以将stall归因到FE/BE,前端无法用uOP填充槽:FE-bound;前端已经准备好uop,但是后端无法处理:BE-bound
2. TMA
TMA L1:每个pipeline slot被分为四类
- Bad speculation:预测指令取错了,结果不能写回(flush pipeline)
- retire:可以从ROB把结果写回CPU state
TMA L2
- Backend Bound(mostly)
- Core Bound
- port utilization
- divider
- xxx
- Memory Bound(mostly)
- L1/L2/L3/DRAM Bound:从cache到主存
- store bound
- xxx
- Core Bound
- Frontend Bound(并不常见)
- Frontend Latency:
- Frontend Bandwidth:前端处理小于4uop的周期
- Bad Speculation
- branch mispredict
- machine clears
- Retiring
- Backend Bound(mostly)
3. CPU Metrics Dictionary
Cycles-based:所占cycles比例,以时间度量通常没有slots-based按照资源度量准确
| TMA metric | Sub-metrics | Sub-sub | Description |
|---|---|---|---|
| Backend Bound | 由于后端缺少硬件资源导致的空闲slots比例 | ||
| Core Bound | |||
| Memory Bound | 由于load/store指令暂停的slots比例 | ||
| Memory Bandwidth | 应用程序由于达到内存DRAM带宽限制而暂停的cycles占总cycles比例 | ||
| Memory Latency | 应用程序由于主存DRAM延迟而暂停的cycles占总cycles比例 | ||
| Cache Bound | 由于L1/L2/L3 cache miss导致的停顿cycles占总cycles的比例 | ||
| L1 Bound | CPU 因 L1 Data Cache 命中后的访问延迟而产生的 Stall Slots 比例 | ||
| L2 Bound | CPU因L1 miss,L2 hit的加载造成stall的Slots比例 | ||
| L2 Hit Bound | 处理L2 hit花费的cycles比例:L2 CACHE HIT COST (const cycles)* L2 CACHE HIT COUNT / ALL CYCLES | ||
| L2 Miss Bound | L2 CACHE MISS COST * L2 CACHE MISS COUNT / ALL CYCLES | ||
| L3 Bound | CPU因L2 miss,L3 hit的加载造成Stall的Slots比例 | ||
| DRAM Bound | CPU因DRAM相关原因的Stall Slots比例 | ||
| DTLB Overhead | DTLB miss带来的性能开销 | ||
| Frontend Bound | 前端没有足够供给后端uop的slots比例 | ||
| Frontend Bandwidth | 由于前端取指带宽导致CPU stall的slots比例(取指令数量较少,没有达到optimal) | ||
| Frontend Latency | 由于Frontend Latency导致CPU stall的slots比例(ITLB/ICache Miss) | ||
| ICache Miss | L1 Instr Cache miss | ||
| ITLB Overhead | ITLB miss => page walk带来的性能开销 | ||
| Bad Speculation | (canceled pipeline slots) | 由于错误的预测浪费的pipeline slots 比例,包括发射没有retire的uOp的slots和等待issue pipeline从错误取指中恢复的slots(issue pipeline是指从scheduler发配到port的一段) | |
| Branch Mispredict | 分支预测错误,错误的指令流被取到pipeline中,这些指令的执行不能被提交(retire)。由于mispredict浪费的slots比例。 | ||
| Branch Resteers | 分支预测错误后,重新引导(steer)回正确path的cycle比例 | ||
| Machine Clears | 一些事件需要清空流水线,从retire的最后一条指令重新开始。三类事件:memory ordering violations, self-modifying code, and certain loads to illegal address range。由于machine clears浪费的slots比例。 | ||
| General Retirement | certain loads to illegal address rangesretiring uOps的pipeline slots比例 | ||
| LLC miss | LLC miss需要访问local/remote主存 | ||
| UTLB overhead | 处理L1 data TLB(UTLB) misses花费的周期比例(TLB也有类似于Cache的多级缓存,一般是L1 data/instr TLB(在微架构上是两个部件),L2 unified TLB) | ||
| Port Utilization | 应用程序由于core中非除法器问题导致stall的周期占总周期的比例 | ||
| Port 0~7 | 分配到port0的uop数/总 core cycles(不同Port后的执行单元不同,不同的uops可能会导致不同的port成为瓶颈) | ||
| CPI(Cycles per instruction retired)/IPC | Good:0.75,Poor:4,理论最优值0.25(一周期发射四条) | ||
| CPU Time | CPU实际执行的时间 | ||
| CPU Utilization | 程序的并行效率、计算程序使用的logical CPU占全部logical CPU的比例 | ||
| DTLB Store Overhead | 处理L1 data TLB store miss的cycle比例 |